01What happened
The story, straight
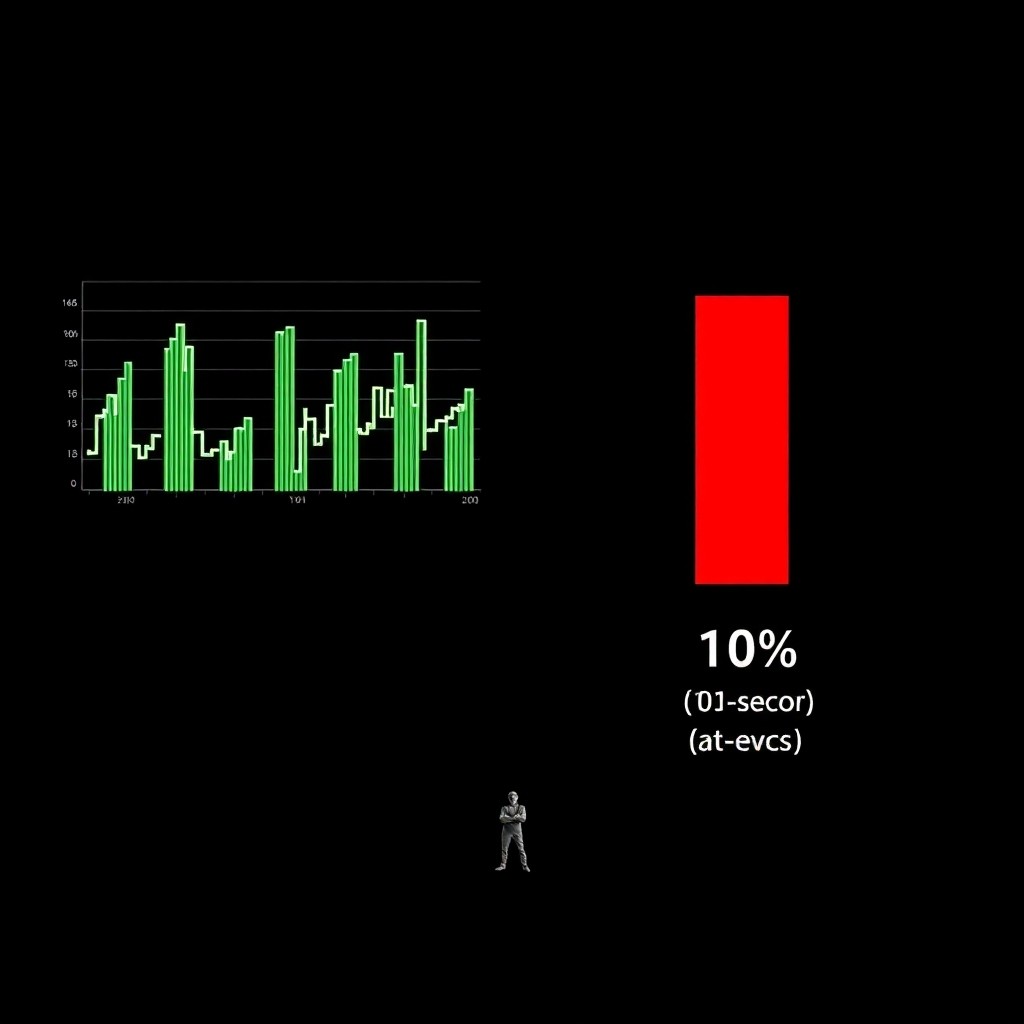
A blog post by Marc Brooker (AWS distinguished engineer) lays out the inspection paradox: a statistical trap where the average user experiences longer latency and longer outages than engineering dashboards report. If 1% of requests take 10 seconds while the rest take 50ms, the dashboard shows a mean near 150ms — but the average request a user touches is weighted toward the slow ones, landing closer to 10 seconds. The same math applies to outages: a system with a sub-1-minute mean time to recovery can still present as hour-long outages to the typical user who happens to hit one. Brooker argues that user-experienced latency follows a size-biased distribution, not the raw request distribution teams usually graph.
marc brooker from aws explains why every engineering team argues with its own users about speed. your dashboard says mean latency is 100ms. your users say it's a full second. the reason: when you average over requests, one slow request counts the same as one fast one. but when alice averages over time, the slow request dominates her experience. same with outages — your MTTR is under a minute, but alex swears he was down for an hour. both are measuring real things, just different distributions.
02Spread timeline
Where it actually started
03Source receipts
Every claim, linked
04What's solid, what isn't
What's solid and what isn't
- Marc Brooker published the blog post explaining the inspection paradox in web service latency.
- The inspection paradox causes user-experienced latency to differ from request-averaged dashboard metrics.
- Brooker's AWS affiliation is implied by his known background but not explicitly stated in the post.
05Why it matters
The editorial take
The inspection paradox is a known statistical phenomenon but rarely gets a clear engineering write-up with concrete numbers. Brooker's framing — 'you measure in requests, users measure in seconds' — gives product and platform teams a specific mental model for why customer-reported pain consistently outpaces internal metrics. As services scale and latency tails grow, the gap between dashboard averages and user experience widens.
this is the 'why does everyone hate our p99' post every platform team needs. it's the statistical explanation for why your on-call says 'everything's green' while your support queue is on fire. as services get more complex and tails get fatter, the gap between what you measure and what alice feels is only growing.